Orbis local test: psf/requests and expressjs/express as 3D dependency graphs
 Contents
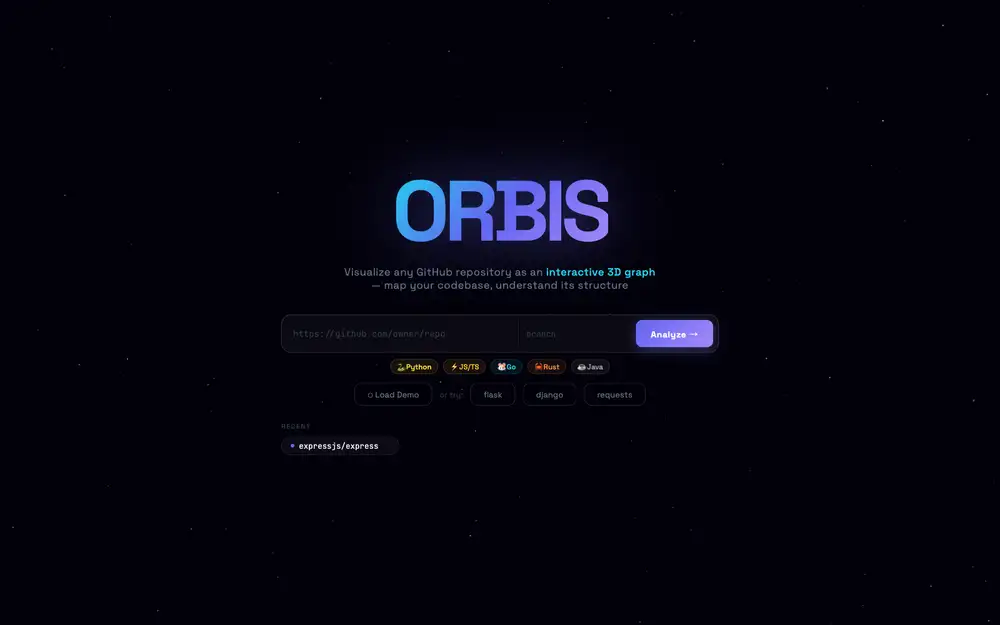
Orbis is a tool that takes a GitHub repository URL, clones the code, parses ASTs, and visualizes inter-module dependencies as a 3D force-directed graph.
I ran the local API in Docker with the AI chat disabled, fed in psf/requests (35 modules) and expressjs/express (98 modules), and tested whether it works as a structure-comprehension UI.
GitHub’s standard Dependency graph picks up package dependencies from manifests and lock files, but Orbis looks at imports and exports in the source code to draw connections between files inside the repo, so for “where does this change ripple to?” before a code review, this is closer than a package list.
Looking at the DEV Community article and the GitHub repository, the architecture is quite small.
A FastAPI backend, neo_parser.py, a vanilla JS SPA, and a demo generation script — that’s about it.
At the time I checked the GitHub API, the license was MIT, star count was 1, default branch was main, and last push was 2026-03-18.
Running it locally
Start Orbis in Docker, leave the AI chat disabled, and just look at the 3D graph.
git clone https://github.com/dakshjain-1616/Orbit-dependency-visualised.git orbis
docker build -t orbis orbis
docker run --rm -p 8001:8001 orbis
I didn’t pass ANTHROPIC_API_KEY, so the chat panel is disabled, but opening http://localhost:8001 shows that graph parsing and rendering still work normally.
The separation pays off here: even without an API key, the structure-comprehension side is testable.
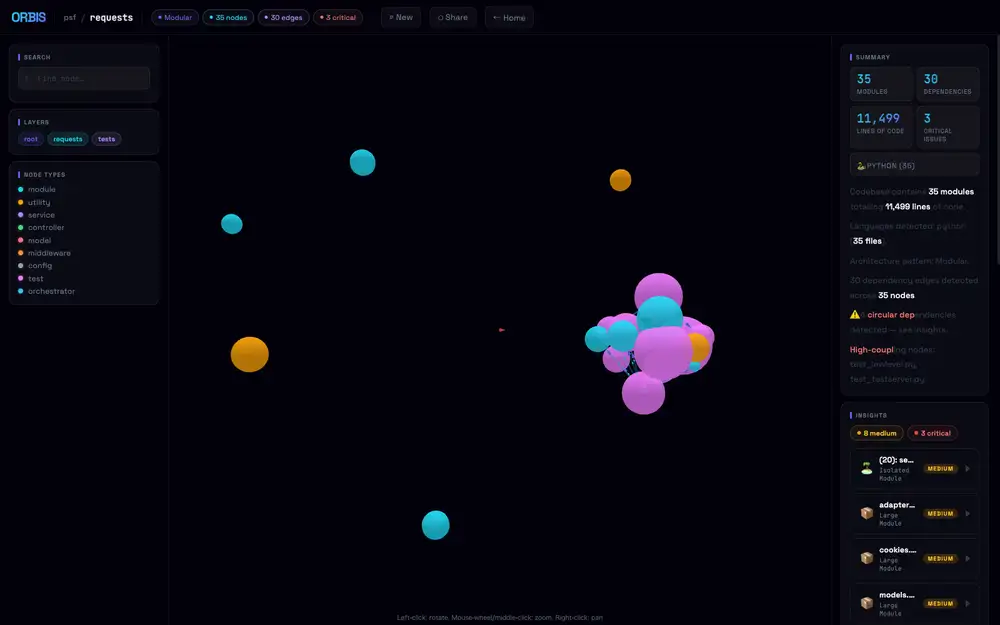
Putting in https://github.com/psf/requests and clicking Analyze returned 35 modules and 30 edges in about 20 seconds.
Arch pattern was Modular, 4 circular dependencies, and the high-coupling list flagged test_lowlevel.py and test_testserver.py.
The test group (pink/violet) forms one clump, while library core (cyan) and a few isolated modules scatter around the outside.
Press P to stop auto-rotation and place the test cluster in front, and it looks like this.
Node radius scales with LOC, so even at 35-node scale the center gets pretty dense.
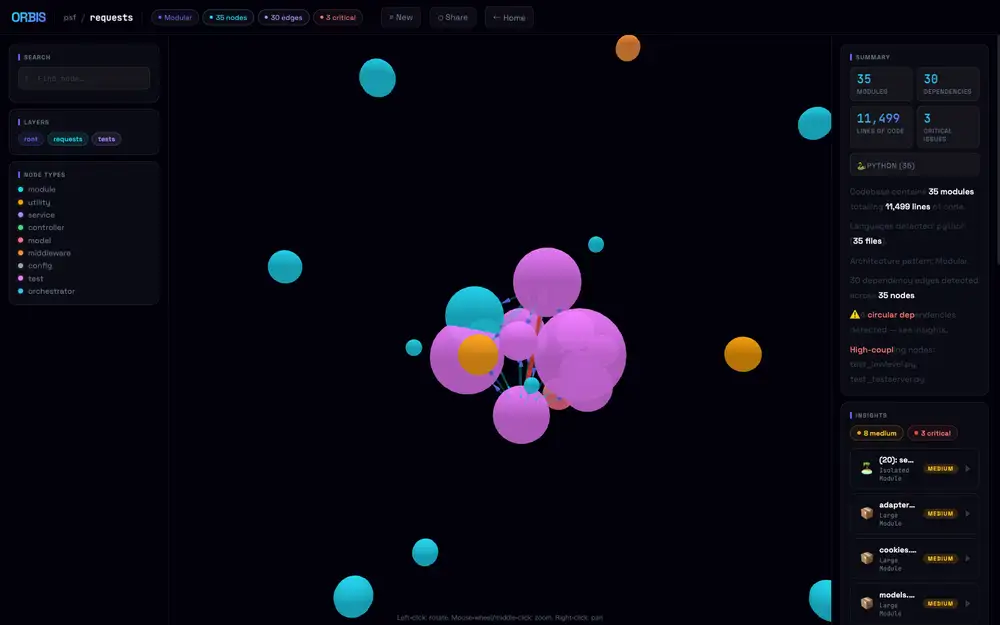
Left-click drag to rotate the camera, and the test cluster shifts to the left while core modules sit around it like satellites.
The actual library code under requests/ (sessions.py, adapters.py, models.py etc.) sits on the perimeter, with test modules forming the dense central mass — that composition only becomes readable from this angle.
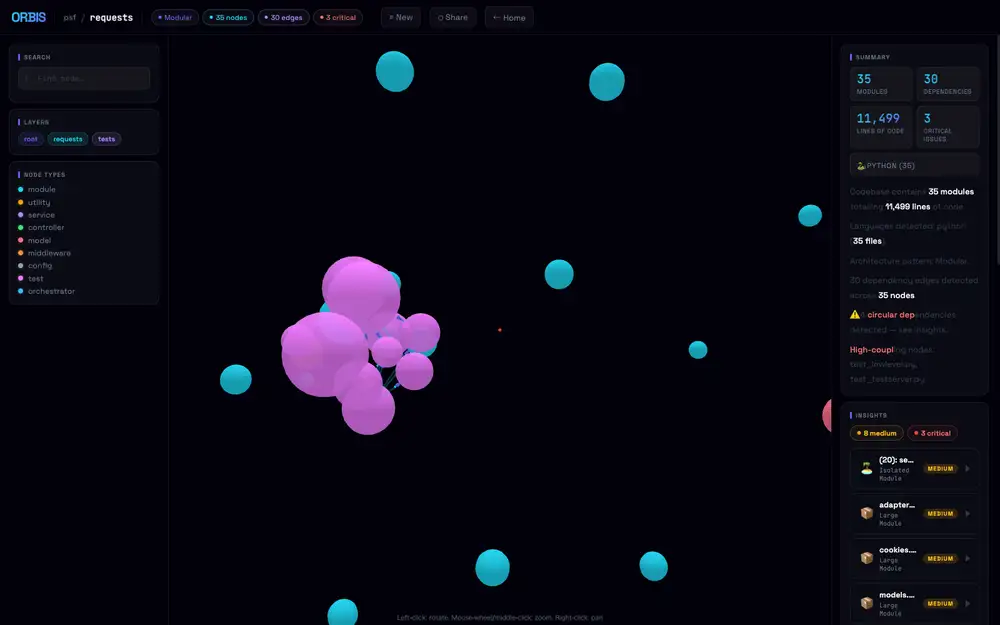
The nodes inside the cluster are also draggable.
Pull a sphere out of the clump and the edges stretch like rubber, dragging neighboring nodes along with it; release and the force layout snaps back into place.
For dense areas where overlapping nodes are unreadable, a quick yank reveals “which test connects to which core” as a line — a practical way to untangle a packed cluster.
I also tried expressjs/express (98 modules), but here the node sizes balloon, overlap each other, and from far away it looks like one giant green sphere.
The 3D layout helps small-to-mid-sized repos. For huge repos you have to use Focus Mode to dim everything but a node’s neighborhood, otherwise it’s unreadable.
The dependency graph becomes the AI chat input
What’s interesting about Orbis is that the analysis result feeds directly into an AI chat context, more than the 3D rendering itself.
/analyze streams progress over SSE and finally returns JSON containing nodes, edges, languages, summary, and insights.
Each node carries metrics like line count, complexity, exported symbols, internal dependencies, external dependencies, and counts of functions and classes.
You can hand that graph to Claude Opus 4.6 and ask pointed questions about circular-dependency origins or refactor candidates.
Instead of dumping the whole repo at the LLM, you build a machine-readable structure from the AST first, and then ask along that structure.
This sits close to “LLM wiki as Markdown + Git” in the WUPHF article — the idea of distilling knowledge into a form an agent can refer back to.
WUPHF promotes work logs and facts into Markdown.
Orbis turns code itself into nodes and edges — an intermediate representation the AI can use in conversation.
Both share the philosophy of building a machine-friendly form first, instead of stuffing raw context into a chat box.
Different from GitHub’s Dependency graph
The name overlaps with GitHub’s Dependency graph, but the layer they look at is different.
GitHub’s official Dependency graph aggregates project package dependencies from manifests, lock files, and the dependency submission API.
It feeds Dependabot alerts, dependency review, and SBOM export — so it’s a graph for supply-chain security and vulnerability management.
Orbis looks at the internal structure of a repository.
It parses Python, JavaScript, TypeScript, Go, Rust, and Java with tree-sitter and turns import relationships between files and modules into edges.
Insights like god modules, high coupling, and circular dependencies come from there.
So you can’t use Orbis to “find a vulnerable transitive npm dependency.”
And conversely, GitHub’s standard Dependency graph won’t show you “which internal modules break if I tear up auth.py.”
The same word “dependency” — one is package management, the other is code structure.
3D is more an exploration UI than eye-candy
3D force-directed graphs look flashy, but reading the Orbis README, it’s clearly built as an exploration UI rather than decoration.
Node size scales with line count, type drives color, and edges carry directional particles.
Click a node and a detail drawer opens with dependencies, metrics, and exported symbols.
Focus Mode dims unconnected nodes, so the natural usage isn’t to take in everything at once but to center on a node of interest and look at just its neighborhood.
Grasping a large repository in 3D as a whole is unrealistic.
But if you narrow to “just the area around this file” or “just the nodes flagged for circular dependency,” it’s easier to switch your gaze than on a giant 2D diagram.
In the GitHub Copilot CLI /fleet article, I looked at the dependencies between subtasks as a DAG.
That was a dependency graph for an execution plan; Orbis is one for code structure.
In AI coding, both come back to the same problem.
Before handing the model a “fix all this nicely,” you need to keep what depends on what externally available.
The weight of cloning a public repo by design
Orbis takes a public GitHub repository URL and clones and analyzes it on the server side.
The README’s Usage section uses public repos like expressjs/express as inputs and shows graph generation in 5–30 seconds.
This design is easy to try, but if you want to point it at an internal repo, the boundaries deserve a second look.
Private repo support, clone-target isolation, post-analysis cleanup, handling files that contain API keys, timeouts on huge repos.
Orbis’s value is in structure extraction, so it’s more natural to run it locally or inside an internal network than ship it to a SaaS.
The AI chat is the same.
The README says the graph still works normally even without ANTHROPIC_API_KEY — only the chat panel errors out.
That separation is good, but the context sent to Claude includes the node list, dependencies, insights, and summary.
Even without full file contents, the module names and the structure itself leak to an external API.
For confidential products, that granularity is enough design information.
What tree-sitter captures and what it doesn’t
Because it uses tree-sitter, imports and exports come out of the syntax tree quickly for supported languages.
Handling Python, JS/TS, Go, Rust, and Java in the same framework is convenient.
neo_parser.py alone absorbs multiple languages, and the frontend just consumes schema-shaped nodes and edges.
That said, an AST alone doesn’t reveal an architecture completely.
Dynamic imports, dependency injection, framework conventions, routing resolved through config files, providers swapped at runtime — these tend to slip past a plain import graph.
The god-module and high-coupling insights, too, are likely close to mechanical judgements based on line count and fan-in, and don’t read design intent.
So when asking the Orbis AI chat “where should I refactor?” it’s better to take answers as a candidate-narrowing pass than as a plan.
When a high-coupling node shows up, open the area around it, then judge alongside tests, change frequency, incident history, and the human responsibility split.
The graph is a tool for choosing a starting point to read from — not the design judgement itself.