Qwen3.8-Flash-Next 125B on EVO-X2 gfx1151: tg128 23.26, 128K context ceiling
 Contents
Last time I ran the 125B Qwen3.8-Flash-Next on an M1 Max 64GB.
This time I put the same GGUF and the same test set through the EVO-X2 I normally run local LLMs on under Windows + ROCm, to see whether it could replace the 27B I use day to day.
Test environment
| Item | Detail |
|---|---|
| Machine | GMKtec EVO-X2 (NucBox_EVO-X2) |
| CPU | AMD Ryzen AI Max+ 395 (16C/32T) |
| GPU | Radeon 8060S (gfx1151), 48GB of VRAM assigned in BIOS |
| Memory | 64GB LPDDR5X (8532 MT/s). Only 15.6GB is left to the system after the VRAM carve-out |
| SSD | Crucial CT1000E100SSD8 (NVMe 1TB) |
| OS | Windows 11 Pro 26200 |
| Driver | AMD Software 26.8.1 / 32.0.31041.1004 |
| llama.cpp | Self-built from PR #27742 at commits b8bdf73 and ef68766, later the official release b10666 (commit 4e97ac86e) |
| ROCm | TheRock nightly 10.1.0a20260812 for the self-build, 7.14.0 for the official release |
| Model | AtomicChat/Qwen3.8-Flash-Next-GGUF AD-3.84bpw-IQ4_XS-M64 (28 shards) + mmproj F16 |
The EVO-X2 pins 48GB to VRAM in BIOS, so the OS cannot hand memory around the way it does on an M1 Max with its 64GB unified pool. Only 15.6GB is left on the system side.
This model looks up a 38.4GB N-gram table keyed on the preceding token sequence, and the table itself can stay on the SSD — which means those reads land on that same 15.6GB.
Where the self-build died
Nobody was shipping a Windows ROCm binary with Qwen3.8-Flash-Next support, so building it myself was the only option.
PR #27742 had not been merged, so src/models/qwen4exp.cpp was absent from upstream master, and it was not in b1317 either, the latest release of lemonade-sdk/llamacpp-rocm that I use on the EVO-X2.
No dev tooling was installed, so I set the build environment up from scratch.
The Visual Studio Build Tools installer does ask for administrator rights, mind you.
I got around that by pulling the whole package set into a directory with vs_BuildTools.exe --layout, unzipping the VSIX files, and expanding the MSIs with msiexec /a.
For the rest, the ROCm SDK came from TheRock’s nightly tar.gz, and cmake and ninja from their official zips.
What ate the most time here was that none of the files I needed were where I expected them.
kernel32.Lib lives in “Windows SDK for Windows Store Apps Libs”, not “Windows SDK Desktop Libs x64”.
msvcrt.lib and oldnames.lib are on the CRT.x64.Store.base side too, not CRT.x64.Desktop.base.
I ended up merging 3,606 headers and 816 libraries to get through.
llama.cpp has no .rc file, yet cmake’s Windows-Clang.cmake demands a resource compiler anyway.
I dodged that by pointing -DCMAKE_RC_COMPILER at the llvm-mc.exe that ships with ROCm.
Starting the resulting binary with default settings killed it during model load.
ggml_cuda_host_malloc: failed to allocate 37265.41 MiB of pinned memory: out of memory
llama_model_load: error loading model: unable to allocate ROCm_Host buffer
The HIP backend asks for 39GB of pinned memory, which 15.6GB of system RAM cannot cover.
On an M1 Max you just start with mmap at its default as the distributor instructs, and the N-gram table gets read through the file cache without ever becoming resident.
HIP, however, tries to copy CPU-side tensors into ROCm_Host, which cannot be paged, so it will not use the mmap’d pages as they are.
So I turned pinning off and pushed the N-gram table explicitly onto a CPU buffer.
set LLAMA_MMAP_RANDOM=1
set GGML_CUDA_NO_PINNED=1
llama-server.exe -m <shard1.gguf> -ngl 99 -lm mmap -ot "per_layer_token_embd=CPU" ...
That got the load through.
43720.58 MiB on the GPU and 36621.27 MiB in the SSD-backed mmap — the same split the distributor documents in the README as “In memory 45.8GB / On SSD 39.1GB” — with all 49 layers offloaded to the GPU.
That was as far as it got. The first compute killed it.
cmn common_init_: warming up the model with an empty run - please wait ...
ggml/src/ggml-cuda/ggml-cuda.cu:107: ROCm error
Running it under llama-bench stopped on the rocBLAS side instead.
rocBLAS error: Could not initialize Tensile host: invalid unordered_map<K, T> key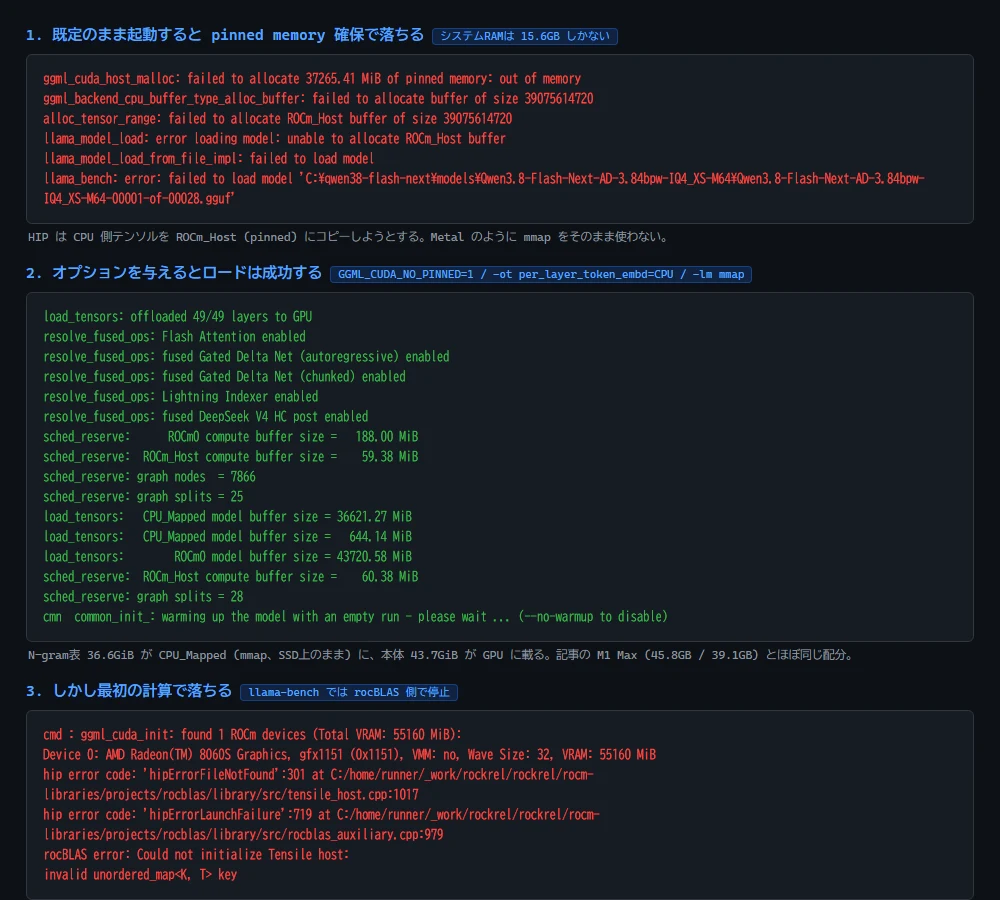
From there I worked through every cause I could think of.
| Hypothesis | Check | Result |
|---|---|---|
| Dead GPU or unrecovered timeout | Ran b1311 + 27B | Ruled out. Normal at pp128 323 t/s |
| Bad self-build | Ran 27B on the same self-built binary | Ruled out. pp64 257 t/s |
| ROCm version mismatch | Rebuilt on 10.1.0a20260812, the same as b1311 | Ruled out. Same error |
| Missing Tensile kernels | Diffed against b1311’s rocblas/library | Ruled out. 150 files, binary identical |
| Missing runtime DLLs | Matched b1311’s layout including origami.dll and rocm_kpack.dll | Ruled out. Same error |
| Current directory | Ran from the same directory as the executable | Ruled out |
| Bypassing rocBLAS | GGML_CUDA_FORCE_MMQ=1 | Not possible. Initialization still runs |
| System RAM shortage | Confirmed 10.6GB free and a 32GB page file | Ruled out |
| GPU memory shortage | Dropped to -ngl 47 / -ngl 40 | Turns into a different error |
| Stale driver | Updated 26.7.1 to 26.8.1 | Ruled out. Same error |
| Stale PR | Moved from b8bdf73 to ef68766 | Ruled out. Same error |
I stopped there.
Checking back on llama.cpp
Going back to look upstream, PR #27742 had been merged into master on August 28 (commit 6c84c7d5, 28 files and 2,881 lines added).
By release tag it lands in b10664 and later.
Windows ROCm binaries had started shipping too.
llama-b10666-bin-win-rocm-7.14-x64.zip sits among the release assets and gfx1151 is in the CI target list, so the self-build is no longer needed.
The LLAMA_MMAP_RANDOM I had been using, on the other hand, had been reverted before the merge.
A commit removing it landed 1 hour 15 minutes after the ef68766 I built, and 13 minutes later TENSOR_READ_LAZY was merged and replaced it with --tensor-read-lazy.
That one targets tensors above 4GiB by default under auto, so a 38.4GB N-gram table falls out of residency with nothing specified.
llama-bench does not have the option, incidentally, but its default is the same auto, so the handling does not change.
Something is missing from the official ROCm binary
Unzipping llama-b10666-bin-win-rocm-7.14-x64.zip (230MiB) on its own turns up no GPUs at all.
> llama-server.exe --list-devices
Available devices:
  (none)
ggml-hip.dll fails to load.
Checking its dependencies, hipblas.dll is required but absent from the 55 files in the zip.
> dumpbin /dependents ggml-hip.dll
    ggml-base.dll
    hipblas.dll        <-- not in the zip
    amdhip64_7.dll
The zip carries only three: amdhip64_7.dll, rocm_kpack.dll, and amd_comgr.dll.
The relevant step in release.yml says rocblas/hipblaslt kernels resolve fine via PATH and are not copied, so the rocBLAS set is left out deliberately.
Those three are in there for the opposite reason: the Adrenalin driver puts an amdhip64_7.dll of the same name in System32, and a copy next to the exe gets read first (issue #26929).
The fix was to install the same ROCm 7.14.0 the CI uses into a venv, from the official wheels AMD publishes.
python -m venv rocm714venv
rocm714venv\Scripts\python.exe -m pip install ^
  --index-url https://repo.amd.com/rocm/whl-multi-arch/ "rocm[libraries]==7.14.0"
rocm714venv\Scripts\python.exe -m pip install ^
  --index-url https://repo.amd.com/rocm/whl-multi-arch/ "rocm-sdk-device-gfx1151==7.14.0"
rocm[libraries] brings hipblas.dll and rocblas.dll.
The Tensile kernels themselves are not in there.
They come with rocm-sdk-device-gfx1151, which unpacks 150 files into _rocm_sdk_libraries\bin\rocblas\library\gfx1151\.
With both installed, put _rocm_sdk_libraries\bin and _rocm_sdk_core\bin on PATH.
Adding the flags to 27B one at a time
Even with ROCm 7.14.0 in place, Flash-Next died in the same spot.
To find out where, I took the 27B that works and added the Flash-Next flags to it one at a time.
| 27B Q8_0 / ngl 99 / fa 1 condition | Result |
|---|---|
| Plain | OK. pp64 278.07 t/s / tg16 7.86 t/s |
Add -lm mmap | OK. pp64 266.84 t/s / tg16 7.82 t/s |
Add LLAMA_ATTN_ROT_DISABLE=1 | OK. pp64 279.40 t/s / tg16 7.85 t/s |
Add GGML_CUDA_NO_PINNED=1 | NG. ggml-cuda.cu:107: ROCm error |
Adding GGML_CUDA_NO_PINNED=1 — which I had been carrying since the self-build to avoid the pinned-memory shortage — was enough to take 27B down with it.
Drop that variable and Flash-Next ran straight through. 27B had never had it attached, which is why that side never fell over.
On b10666 the --tensor-read-lazy default kicks in and keeps the N-gram table out of residency from the start.
create_tensor: tensor per_layer_token_embd.weight (size = 36621 MiB) lazy read enabledNo pinned allocation happens at all, so GGML_CUDA_NO_PINNED is unnecessary, and it broke things when set.
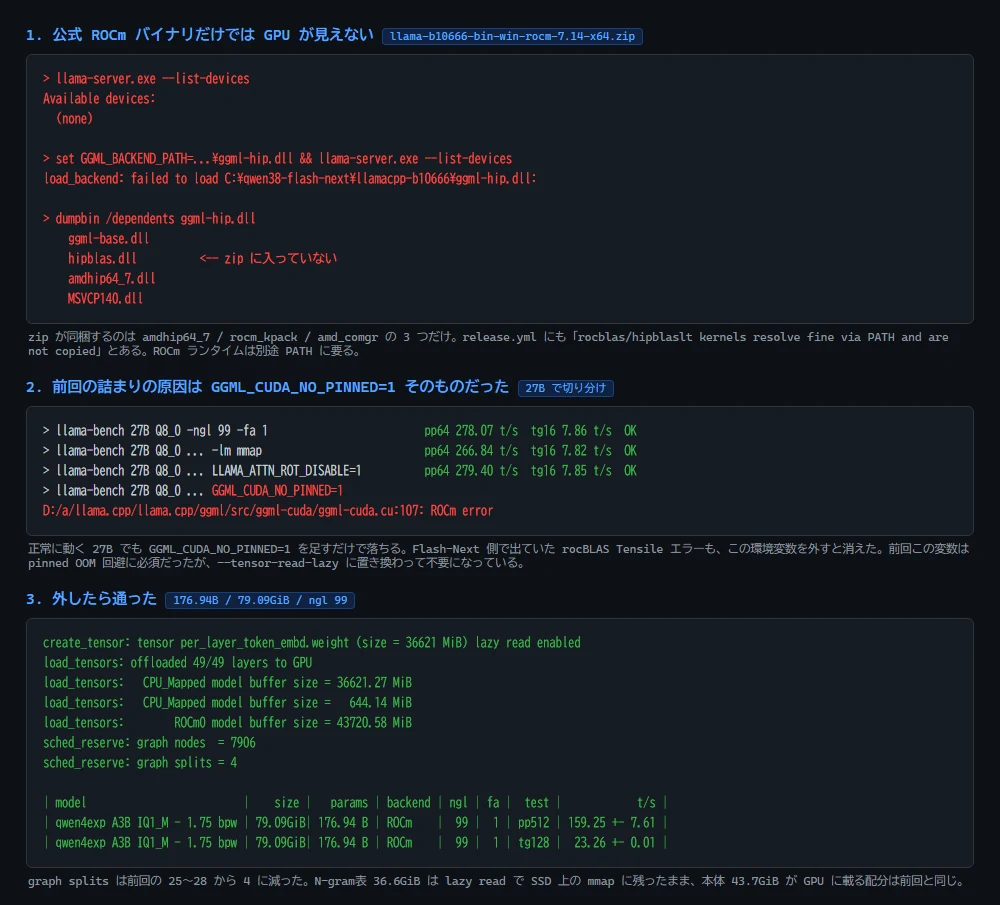
Load and split
Passing -ot together with mmap makes the loader warn consider using --load-mode none for better performance.
Going to --load-mode none would make the N-gram table resident, though, so it is not an option in this configuration.
Loading it as-is took 159.5 seconds under llama-bench and 2 minutes 26 seconds under llama-server with mmproj.
The GPU held 43720.58 MiB and the SSD-backed mmap held 36621.27 MiB plus 644.14 MiB — the same split as the self-build — but graph splits had dropped from 25–28 to 4.
| M1 Max (distributor README) | EVO-X2 self-build | EVO-X2 b10666 | |
|---|---|---|---|
| Held on GPU | 45.8GB | 43720.58 MiB | 43720.58 MiB |
| mmap on SSD | 39.1GB | 36621.27 + 644.14 MiB | Same |
graph splits | — | 25–28 | 4 |
Here are the llama-bench numbers.
| test | t/s |
|---|---|
| pp512 | 159.25 ± 7.61 |
| tg128 | 23.26 ± 0.01 |
pp is the prompt-reading side and tg the answer-writing side, with the trailing number giving the token count involved.
Do the two Issues reproduce
Two Issues were open against the same gfx1151, so I tried both, and neither reproduced.
Issue #27856 reports a drop from 19–21 t/s to around 6 t/s once you pass 1K tokens.
I swept the amount of context already in place (the KV cache length) with llama-bench’s -d, and it only falls off gradually — nothing like the sharp drop in the report.
| KV length | 0 | 1K | 4K | 16K | 32K | 64K |
|---|---|---|---|---|---|---|
| tg32 | 22.86 | 19.36 | 17.64 | 14.15 | 11.76 | 8.54 |
Still 14.15 t/s at 16K, so there seems to be no need to wait for the WIP PR #27860.
Whether the relevant path changed in b10666, or whether this is specific to Linux + ROCm 7.2, I cannot tell.
The other one, Issue #27797, is about output degenerating into a stream of / when a prompt has two or more message segments, with LLAMA_ATTN_ROT_DISABLE=1 given as the fix.
To get two or more segments, I ran a 3-turn persona conversation twice, with and without the variable.
| Turn 1 | Turn 2 | Turn 3 | |
|---|---|---|---|
LLAMA_ATTN_ROT_DISABLE=1 | 177 tok / 23.4 t/s | 284 tok / 23.7 t/s | 297 tok / 23.8 t/s |
| Without | 184 tok / 23.2 t/s | 312 tok / 23.4 t/s | 447 tok / 23.4 t/s |
Neither run produced a / stream, both kept the voice and the persona across all three turns, and there was no speed difference.
On b10666 it was not needed.
How far the context length stretches
I normally run 27B at --ctx-size 65536, so a replacement needs to match that at minimum.
I rebuilt llama-server at various -c values and measured generation speed twice each on an empty context.
-c | tg (2 runs) |
|---|---|
| 65536 (64K) | 23.71 / 25.78 t/s |
| 98304 (96K) | 20.99 / 22.37 t/s |
| 131072 (128K) | 23.64 / 25.61 t/s |
| 147456 (144K) | 5.22 / 5.32 t/s |
| 163840 (160K) | 5.22 / 5.24 t/s |
| 262144 (256K) | 3.72 / 3.82 t/s |
It falls to a fifth somewhere between 131072 and 147456.
The model’s n_ctx_train is 262144, so what is biting is the VRAM allocation rather than the model.
KV is light here — only 12 of the 48 layers use full attention — at 16.5 MiB per 512 cells and roughly 33KiB per token, so 128K worth is about 4.2GiB.
Add the model’s 43.7GiB and the 47.9GiB total fits just inside the 48GB assigned in BIOS, and anything past that spills into shared system memory.
The load itself goes through even at 256K, so with no error raised you only notice once it gets slow.
One more thing: starting llama-server at a large -c, stopping it, and immediately bringing up the next one failed with ROCm error: unspecified launch failure. That happened twice, and leaving about 25 seconds before starting again avoided it.
Free physical RAM and generation speed
Raising the VRAM assignment from 48GB to 56GB should move the point where speed drops.
So I measured main memory while Flash-Next was running.
Flash-Next -c 131072 | 27B (normal setup) | |
|---|---|---|
| llama-server working set | 10,707 MB | 3,128 MB |
| Private commit | 49,713 MB | 34,523 MB |
| Free physical RAM | 441 MB | 7,958 MB |
| Committed / limit | 65,693 / 66,497 MB | 52,666 / 54,343 MB |
Running 27B leaves 7.96GB free, near enough 8GB, but Flash-Next’s working set alone is 10.7GB.
Cutting physical RAM to 8GB would leave nowhere for that 10.7GB, and committed memory was already pinned at 98.8% of the limit.
Adding a single process of around 100MB in that state changed the speed.
| Condition | Free physical RAM | tg |
|---|---|---|
| Clean | 850 MB | 24.2 t/s |
| One 100MB process added | 173 MB | 5.3 t/s |
A 100MB difference is worth more than 4x.
27B measured at the same time gave pp64 261.92 / tg16 7.76, normal, so this does not look like a problem with the machine.
The same 5 tests as the M1 Max run
The 5 tests ran against llama-server at -c 32768.
| # | Test | Gen tok | Gen t/s | Prefill t/s | Wall | Thinking |
|---|---|---|---|---|---|---|
| 1 | BST insert (thinking ON) | 394 | 24.2 | 64.8 | 17.5s | 1,216 chars |
| 1 | BST insert (thinking OFF) | 94 | 25.9 | 96.5 | 4.1s | — |
| 2 | Simple BBS (thinking OFF) | 7,508 | 18.8 | 92.0 | 399.7s | — |
| 2 | Simple BBS (thinking low) | 2,178 | 21.6 | 99.4 | 101.9s | 454 chars |
| 2 | Simple BBS (thinking xhigh) | 12,288 | 17.6 | 116.5 | 697.8s | cut off at 38,172 chars |
| 3 | Persona, 3 turns | 177 / 284 / 297 | 23.4 / 23.7 / 23.8 | — | 8.8 / 12.9 / 13.8s | 192 / 671 / 561 chars |
| 4 | NSFW, 3 levels | 365 / 611 / 314 | 23.5 / 23.6 / 23.9 | — | 16.4 / 26.9 / 14.0s | 494 / 1,709 / 421 chars |
| 5 | Vision | 2,048 | 19.4 | 194.6 | 109.8s | 4,324 chars |
Generation runs at 23–26 t/s plain, dropping toward 17–19 t/s on longer outputs.
For the simple BBS, the thinking-OFF run produced a single HTML file called “ことばの広場”, with a character counter and three sample posts in it.

Thinking xhigh hit the limit after 38,172 characters of reasoning and came out as a blank page. The M1 Max and the 27B did the same thing.
Of the three NSFW levels, the plain prompt and the one explicitly asking for direct description were both refused.
Only B, which asserted in the system message that restrictions were lifted, came back with a partial response, and even that was a literary short piece prefaced by an explicit statement that instructions embedded in the prompt do not change its operating settings.
For Vision I fed in the screenshot (900×900) of the BBS built in test 2 with thinking OFF.
Prefill was 194.6 t/s, and it correctly decomposed the structure — header, intro text, the form on the left, the post list on the right — and transcribed nearly all of the on-screen text.
It even went as far as the part not shown, noting “it says three posts but only two are visible on screen, so there is presumably one more below”.
The one mistake was reading the placeholder “名乗りたければ、ここへ” as “名乗るたけであれば、ここへ”.
Comparing 3 models on 60K+ tokens
Speed on an empty context is not enough to decide whether the 27B is worth replacing.
I sent the same prompt to the same llama-server (b10666 + ROCm 7.14.0) and compared 3 models.
The MTP the 27B uses verifies a batch of look-ahead tokens against the main model, so on repetitive text its hit rate comes out higher than it really is.
I therefore picked non-repetitive real text for the prompt: 175,000 characters, working out to 62,538–62,580 tokens depending on the model.
| Model | Setup | tg empty | tg at 62K | Prefill @62K | 62K completion |
|---|---|---|---|---|---|
| Qwen3.6-35B-A3B Q6_K (old setup) | -c 65536 KV q8_0 | 57.52 | 36.49 | 516.51 t/s | 122.9s |
| Qwen3.8-27B Q8_0 + MTP (current) | -c 65536 | 22.44 | 11.54 | 209.98 t/s | 299.6s |
| Qwen3.8-Flash-Next | -c 131072 mmap + lazy | 22.94 | 8.55 | 115.89 t/s | 547.3s |
On an empty context it matches the 27B, but pack it to 62K and Flash-Next is the slowest of the three.
The way each one falls off with context length is completely different.
| KV length | 0 | 16K | 32K | 64K | Drop |
|---|---|---|---|---|---|
| Flash-Next | 22.86 | 14.15 | 11.76 | 8.54 | −63% |
| 27B (no MTP) | 7.83 | 7.59 | 7.32 | 6.86 | −12% |
The 27B reads every parameter for each token, so generation time barely moves as context grows.
Flash-Next only uses 6B per token, which leaves sparse attention and the N-gram table taking a proportionally larger share of the time.
The 27B’s MTP hit rate also drops, incidentally, from 92% to 46%.
The tokenizer is identical between the 27B and Flash-Next (248320 vocab), and token counts did not differ by a single token across four samples, so the context lengths convert cleanly into characters.
| Text type | Chars/token | 27B -c 65536 | Flash-Next -c 131072 |
|---|---|---|---|
| Japanese technical prose (mixed code) | 2.01 | ~132K chars | ~263K chars |
| Japanese ordinary prose | 2.60 | ~170K chars | ~340K chars |
| HTML / code | 2.94 | ~192K chars | ~385K chars |
| English | 3.52 | ~231K chars | ~461K chars |
340K characters of Japanese prose is about three paperbacks’ worth.
I am keeping 27B + MTP as the model I actually run.
The context is twice as large, sure, but it is the slowest of the three exactly where that second half would be used.
Occupying 80GiB of disk permanently and taking two and a half minutes to load does not fit a setup that restarts under a watchdog either.
On raw speed the old Qwen3.6-35B-A3B setup was fastest on every metric, so I ran the same 5 tests against it too.
It does not reach the others on instruction-following or on how much it builds out: the persona starts using emoji on its own and loses the character settings, and the BBS comes out generic.
In exchange, all 11 runs finished in 2 minutes 40 seconds against roughly 21 minutes for Flash-Next — a different order of magnitude.
The run-server-qwen36-backup.bat I stood up for that test had --reasoning-budget 0 without --jinja.
Neither enable_thinking nor reasoning_effort has any effect that way.
Adding --jinja got it interpreting up to reasoning_effort: xhigh, and 774 characters of reasoning came out.