Hideki Matsui's hitting compared with Sadaharu Oh and later Giants cleanup hitters
 Contents
On October 23, 2026, the Yomiuri Giants announced Hideki Matsui as their new manager.
He will wear No. 90, the number Shigeo Nagashima wore for six seasons starting with his first year as Giants manager in 1975 (Jiji Press, NHK, both in Japanese).
He has not managed a single game yet, and his career story is already on Wikipedia.
I am a Matsui fan, so I calculated his numbers as a hitter instead.
The scope is his ten years with the Giants (1993–2002) and his ten years in MLB (2003–2012), each measured against that season’s league average.
I compare him with past Giants managers, starting with Sadaharu Oh, and with the hitters who batted cleanup (fourth in the order) for the Giants after he left.
Environment and data
| Item | Details |
|---|---|
| OS | Windows 11 |
| Python | 3.12.11 (virtual environment created with uv) |
| Libraries | pandas 3.1.0, pybaseball 2.2.7, matplotlib 3.11.2 |
All data was fetched with Python and aggregated with pandas.
| Source | Contents | How it was fetched |
|---|---|---|
| Nippon Professional Baseball Records (2689web.com) | Central League team batting totals by season (including walks, hit-by-pitches and sacrifice flies) and batting lines for qualified hitters, 1958–2025 | Tables on each season page |
| NPB official site | Matsui’s season-by-season Giants stats (including grounded-into-double-plays) | Table on his player page |
| Japanese Wikipedia list of Giants cleanup hitters | The hitter who started the most games in the cleanup spot each season | Referenced from the article’s table |
| MLB Stats API | MLB season stats, batting and fielding value metrics (wRC+, WAR and its components, explained in the MLB WAR section), situational splits, postseason, American League team totals | JSON from statsapi.mlb.com |
| Baseball Savant | Pitch-by-pitch data from 2008 on (location, pitch type, velocity, swing or take, batted-ball direction) | pybaseball’s statcast / statcast_batter |
The MLB Stats API returns JSON without authentication, so the standard library is enough.
For example, the code below pulls Matsui’s 2004 wRC+ and WAR (425686 is his player ID).
import json, urllib.request

url = "https://statsapi.mlb.com/api/v1/people/425686/stats?stats=sabermetrics&group=hitting&season=2004"
stat = json.load(urllib.request.urlopen(url))["stats"][0]["splits"][0]["stat"]
print(round(stat["wRcPlus"]), round(stat["war"], 1))  # 140 3.0
To compute the league-wide on-base percentage, you need league totals for walks, hit-by-pitches and sacrifice flies.
I first opened the season pages on the NPB official site, but the team batting tables before 2004 do not include walks.
The Japanese Wikipedia templates for season team batting had walks for Matsui’s era, but the 1962 and 1973 entries from Oh’s era were blank.
In the end I used the tables on 2689web.com, which list walks, hit-by-pitches and sacrifice flies in the same format from 1958 through 2025.
For MLB metrics, FanGraphs and Baseball-Reference are the usual sources, but both returned 403 to script access, so I used the values from the MLB Stats API.
The API’s wRC+ and WAR are calculated differently from those two sites’ published values and may not match them.
I did not cross-check against those two sites.
The yardstick is OPS+
Because the hitters come from different eras and leagues, each line is divided by that season’s league average.
The metric is OPS+: divide on-base percentage and slugging percentage by the league averages, add the two ratios, subtract 1 and multiply by 100.
A league-average hitter comes out at exactly 100, and a 200 means both OBP and SLG are roughly 1.5 times the league average.
OBP and SLG are calculated with the formulas below.
For the league values, I summed hits, walks and the other counts across the six Central League teams and put the totals into the same formulas.
| Stat | Formula |
|---|---|
| OBP | (H + BB + HBP) ÷ (AB + BB + HBP + SF) |
| SLG | Total bases ÷ AB |
For example, in 2002 Matsui had a .461 OBP and a .692 SLG, while the Central League as a whole had a .313 OBP and a .394 SLG.
.461 ÷ .313 is about 1.47 and .692 ÷ .394 is about 1.76, so adding them and subtracting 1 gives about 2.23, and multiplying by 100 gives an OPS+ of about 223.
The standard OPS+ published by Baseball-Reference and others also adjusts for how hitter-friendly each ballpark is.
The OPS+ in this article only divides by the league average, so two things are not adjusted.
| Not adjusted for | Effect |
|---|---|
| Ballpark size and hitter-friendliness | Differences between Korakuen Stadium (Oh’s era) and Tokyo Dome (Matsui’s era) remain in the numbers |
| Pitchers batting | Pitchers bat in the Central League, which lowers the league average and pushes position players’ OPS+ up. These values cannot be compared directly with values calculated for the American League, which uses the designated hitter |
For Central League hitters compared with each other the conditions are close enough, so I use it as-is for Oh, Matsui and the later cleanup hitters.
Matsui with the Giants
The table below lists Matsui from 1994 through 2002, the seasons in which he reached the qualifying plate appearances, with his rank among qualified Central League hitters.
In 1993 he was a rookie straight out of high school and did not qualify.
Qualifying plate appearances are the threshold for batting-average titles such as the batting crown, and in NPB it is “team games × 3.1.”
Ranks are by OPS+, and the “/31” denominator is the number of Central League hitters who qualified that season.
| Year | PA | HR | OBP | SLG | OPS+ | Central League rank |
|---|---|---|---|---|---|---|
| 1994 | 569 | 20 | .368 | .475 | 134 | 8th/31 |
| 1995 | 569 | 22 | .363 | .481 | 131 | 9th/30 |
| 1996 | 569 | 38 | .401 | .622 | 174 | 2nd/38 |
| 1997 | 596 | 37 | .419 | .564 | 169 | 2nd/34 |
| 1998 | 603 | 34 | .421 | .563 | 175 | 1st/35 |
| 1999 | 573 | 42 | .416 | .631 | 178 | 3rd/31 |
| 2000 | 590 | 42 | .438 | .654 | 198 | 1st/29 |
| 2001 | 611 | 36 | .463 | .617 | 195 | 2nd/34 |
| 2002 | 623 | 50 | .461 | .692 | 223 | 1st/30 |
In the seven seasons from 1996, his OPS+ was 169 or higher every year and he ranked no lower than third in the Central League.
His last season, 2002, was his best with the Giants: 50 home runs and a 223 OPS+.
Compared with Sadaharu Oh and other Giants managers
Among the Giants managers hired since 1975, I took the five who were position players (Sadaharu Oh, Shigeo Nagashima, Tatsunori Hara, Yoshinobu Takahashi and Shinnosuke Abe) and calculated the same OPS+ for their playing careers.
Motoshi Fujita and Tsuneo Horiuchi also managed in that period but were pitchers, so they are not included.
The list of managers comes from the managers table in the Japanese Wikipedia article on the Yomiuri Giants, and only seasons in which they qualified in the Central League as Giants players are counted.
| Hitter | Became manager | Qualified seasons | Best OPS+ (year) | OPS+ 200+ | OPS+ 170+ | League-best | PA-weighted average |
|---|---|---|---|---|---|---|---|
| Sadaharu Oh | 1984 | 21 | 279 (1973) | 15 | 17 | 14 | 221 |
| Shigeo Nagashima | 1975 | 17 | 249 (1961) | 7 | 11 | 4 | 181 |
| Hideki Matsui | Announced Oct. 2026 | 9 | 223 (2002) | 1 | 6 | 3 | 176 |
| Shinnosuke Abe | 2024 | 12 | 206 (2012) | 1 | 2 | 2 | 146 |
| Tatsunori Hara | 2002 | 12 | 169 (1986) | 0 | 0 | 0 | 143 |
| Yoshinobu Takahashi | 2016 | 8 | 168 (2007) | 0 | 0 | 1 | 146 |
Matsui ranks third behind Oh and Nagashima on both his best season and his average, and among managers hired after Oh’s tenure (1984–1988), the only one ahead of him is Nagashima, who returned in 1993.
Measured by their hitting, Matsui is the first Giants manager since the “ON” pair (a nickname built from the initials of Oh and Nagashima).
Counting home runs alone changes the order.
Matsui hit 332 home runs for the Giants, fewer than Nagashima’s 444, Abe’s 406 and Hara’s 382.
That is because he spent only ten years with the Giants, and adding his 175 MLB home runs brings his combined total to 507.
The gap to Oh is large: Oh had 15 seasons with an OPS+ of 200 or more and led the league eleven years in a row from 1964 to 1974.
Matsui topped 200 only once, in 2002, and that 223 would rank sixth from the bottom among Oh’s fifteen 200-plus seasons.
To check whether the gap holds at the same age, I plotted both players’ OPS+ by age.
The dotted line is Matsui’s MLB OPS+, calculated against the American League average, for seasons with 500 or more plate appearances.
The American League uses the designated hitter, so pitchers do not bat, and those values cannot be read at the same height as the Central League values.
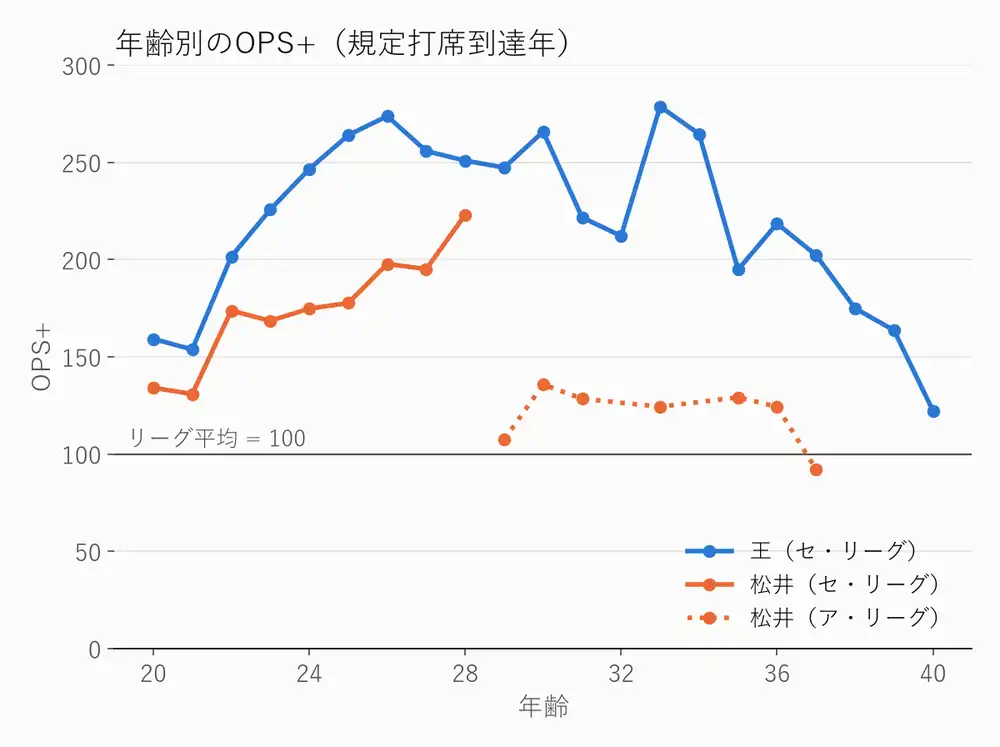
Even at 28, when Matsui posted his Central League best of 223, Oh was ahead at the same age with 251.
Giants cleanup hitters after Matsui
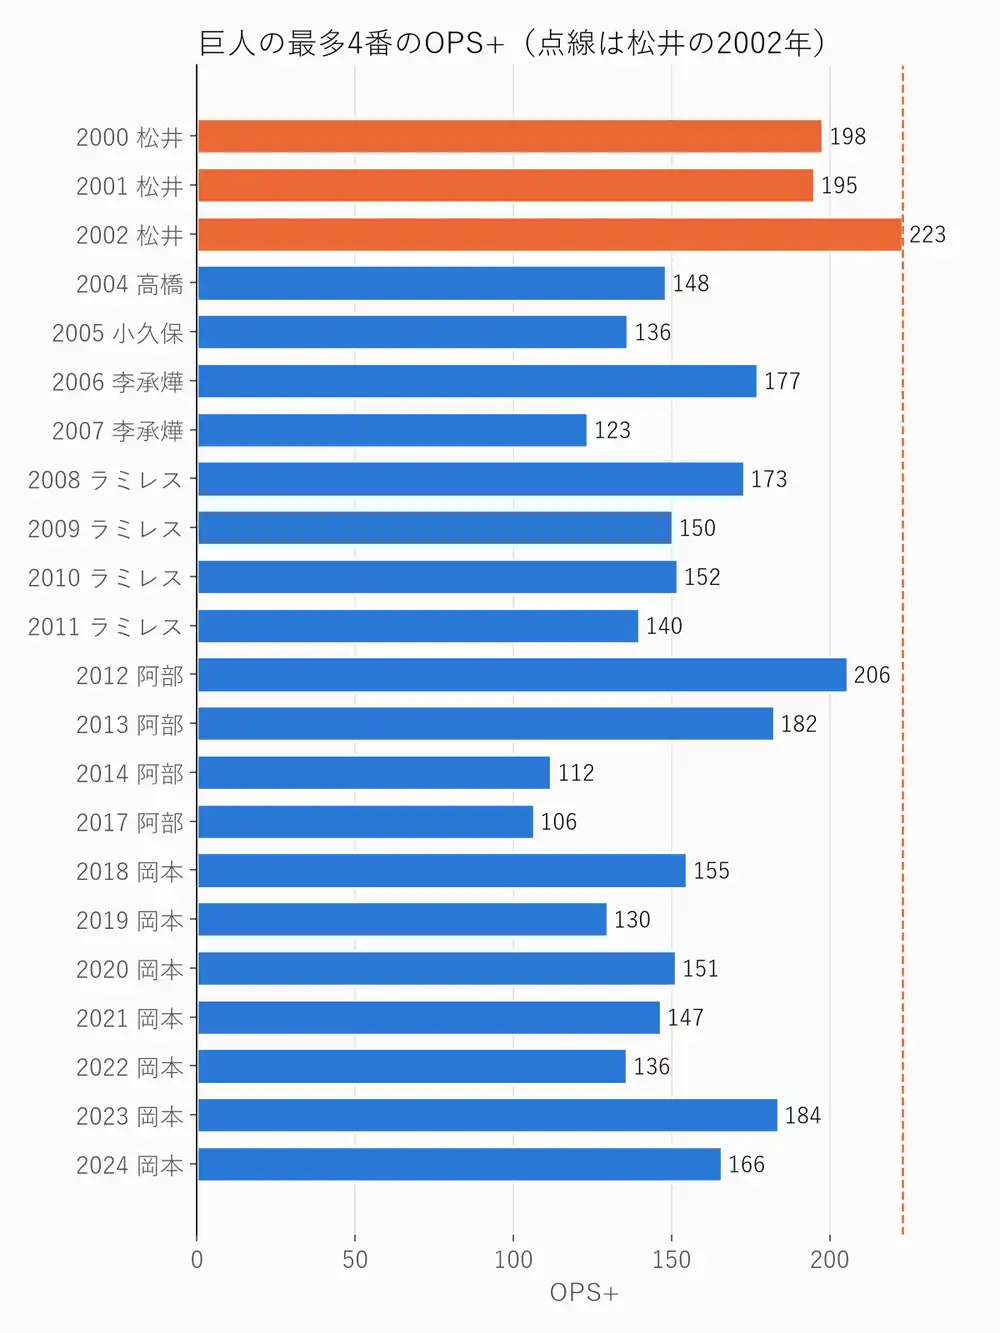
For each season after Matsui left for MLB in 2003, I calculated the OPS+ of the hitter who started the most games in the cleanup spot.
I could not collect game-by-game batting order data, so I used the “most games batting fourth” entry for each season from the Wikipedia list.
Seasons in which that hitter did not qualify are excluded: 2003 (Roberto Petagine), 2015 and 2016 (Abe) and 2025 (Kazuma Okamoto).
| Year | Hitter | PA | HR | OBP | SLG | OPS+ | Central League rank |
|---|---|---|---|---|---|---|---|
| 2000 | Hideki Matsui | 590 | 42 | .438 | .654 | 198 | 1st/29 |
| 2001 | Hideki Matsui | 611 | 36 | .463 | .617 | 195 | 2nd/34 |
| 2002 | Hideki Matsui | 623 | 50 | .461 | .692 | 223 | 1st/30 |
| 2004 | Yoshinobu Takahashi | 477 | 30 | .387 | .580 | 148 | 8th/38 |
| 2005 | Hiroki Kokubo | 592 | 34 | .361 | .523 | 136 | 9th/34 |
| 2006 | Seung-yeop Lee | 592 | 41 | .389 | .615 | 177 | 3rd/29 |
| 2007 | Seung-yeop Lee | 583 | 30 | .322 | .501 | 123 | 15th/34 |
| 2008 | Alex Ramirez | 600 | 45 | .373 | .617 | 173 | 2nd/33 |
| 2009 | Alex Ramirez | 608 | 31 | .347 | .544 | 150 | 5th/29 |
| 2010 | Alex Ramirez | 606 | 49 | .338 | .613 | 152 | 5th/31 |
| 2011 | Alex Ramirez | 515 | 23 | .322 | .453 | 140 | 6th/24 |
| 2012 | Shinnosuke Abe | 556 | 27 | .429 | .565 | 206 | 1st/24 |
| 2013 | Shinnosuke Abe | 529 | 32 | .427 | .564 | 182 | 3rd/21 |
| 2014 | Shinnosuke Abe | 526 | 19 | .340 | .425 | 112 | 18th/27 |
| 2017 | Shinnosuke Abe | 512 | 15 | .329 | .389 | 107 | 23rd/28 |
| 2018 | Kazuma Okamoto | 616 | 33 | .394 | .541 | 155 | 8th/31 |
| 2019 | Kazuma Okamoto | 628 | 31 | .343 | .485 | 130 | 12th/30 |
| 2020 | Kazuma Okamoto | 500 | 31 | .362 | .545 | 151 | 8th/27 |
| 2021 | Kazuma Okamoto | 592 | 39 | .341 | .530 | 147 | 5th/32 |
| 2022 | Kazuma Okamoto | 589 | 30 | .336 | .469 | 136 | 7th/27 |
| 2023 | Kazuma Okamoto | 589 | 41 | .374 | .584 | 184 | 1st/27 |
| 2024 | Kazuma Okamoto | 611 | 27 | .362 | .501 | 166 | 3rd/24 |
In the 19 seasons from 2003 to 2024, no cleanup hitter beat Matsui’s 223 from 2002.
The only one to beat the 198 he posted in 2000, his first year as the fixed cleanup hitter, was Abe with 206 in 2012, and the other 18 seasons all fall below Matsui’s three cleanup years (195–223).
Alex Ramirez hit 49 home runs in 2010, but his OBP was .338 and his OPS+ was 152.
Their home run totals were close, and the gap is in walks: Matsui drew 114 in 2002 and had a .461 OBP.
Per-plate-appearance rates in NPB and MLB
I compared his last four years with the Giants (1999–2002) and his five years with the Yankees (2003–2007) on a per-plate-appearance basis.
The NPB numbers come from the NPB official site and the MLB numbers from the MLB Stats API season stats.
For the averages, I used all four NPB years and four MLB years, leaving out 2006, when he had only 201 plate appearances.
HR%, BB% and K% are each count divided by plate appearances.
ISO is slugging percentage minus batting average, which isolates extra-base power by removing singles.
| League | Year | PA | HR% | BB% | K% | ISO | OBP | GIDP |
|---|---|---|---|---|---|---|---|---|
| NPB | 1999 | 573 | 7.3% | 16.2% | 17.3% | .327 | .416 | 3 |
| NPB | 2000 | 590 | 7.1% | 18.0% | 18.3% | .338 | .438 | 1 |
| NPB | 2001 | 611 | 5.9% | 19.6% | 15.7% | .284 | .463 | 9 |
| NPB | 2002 | 623 | 8.0% | 18.3% | 16.7% | .358 | .461 | 4 |
| MLB | 2003 | 695 | 2.3% | 9.1% | 12.4% | .148 | .353 | 25 |
| MLB | 2004 | 680 | 4.6% | 12.9% | 15.1% | .224 | .390 | 11 |
| MLB | 2005 | 704 | 3.3% | 8.9% | 11.1% | .191 | .367 | 16 |
| MLB | 2006 | 201 | 4.0% | 13.4% | 11.4% | .192 | .393 | 6 |
| MLB | 2007 | 634 | 3.9% | 11.5% | 11.5% | .203 | .367 | 9 |
Comparing the four-year NPB average with the four-year MLB average, HR% went from 7.1% to 3.5% and BB% from 18.0% to 10.6%, both roughly halved.
ISO also dropped from .327 to .192.
K%, on the other hand, fell from 17.0% to 12.5%.
Power and walks dropped while strikeouts also dropped, so it looks like in MLB he was cutting down on swings and misses and putting the ball in play.
His grounded-into-double-plays went from 4 in 2002 to 25 in 2003.
That year his outs were skewed toward ground balls: ground-ball outs divided by fly-ball and line-drive outs (GO/AO) was 1.66, the highest of his ten MLB seasons.
In 2004 it dropped to 0.91, and his home runs went from 16 to 31.
His OPS+ against the American League average was 107 in 2003 and 136 in 2004.
Across his seven qualified MLB seasons, the lowest was 92 in 2011 and the highest 136 in 2004.
MLB wRC+ and the WAR breakdown
For his MLB value I use the wRC+ and WAR returned by the MLB Stats API.
| Metric | Meaning |
|---|---|
| wOBA | Walks, singles, doubles, home runs and so on, each weighted by how much it contributes to scoring and summed. It tracks run scoring better than OPS |
| wRC+ | Runs created by batting, scaled so the league average is 100. A 140 means 40% more runs than a league-average hitter |
| WAR | How many more wins the player added compared with a replacement-level (backup-caliber) player in his place |
The MLB Stats API also returns the WAR components.
Batting, fielding, baseRunning and positional are each expressed in runs relative to an average player.
Add the league adjustment (wLeague) and the replacement-level credit (replacement) to those four, divide by the runs needed for one win, and you get WAR.
The positional adjustment accounts for how hard each position is: shortstops and catchers get a plus, first basemen and left fielders a minus.
Designated hitters, who do not play the field, get the biggest deduction.
The table shows his yearly wRC+ and WAR with his rank among qualified American League hitters.
In 2006 (51 games), 2008 (93 games) and 2012 (34 games) he did not qualify.
| Year | Team | PA | wRC+ | AL rank (wRC+) | WAR | AL rank (WAR) |
|---|---|---|---|---|---|---|
| 2003 | Yankees | 695 | 109 | 44th/85 | 0.2 | 75th/85 |
| 2004 | Yankees | 680 | 140 | 8th/77 | 3.0 | 43rd/77 |
| 2005 | Yankees | 704 | 128 | 16th/82 | 2.5 | 39th/82 |
| 2006 | Yankees | 201 | 130 | - | 0.7 | - |
| 2007 | Yankees | 634 | 124 | 19th/82 | 2.9 | 35th/82 |
| 2008 | Yankees | 378 | 112 | - | 0.8 | - |
| 2009 | Yankees | 528 | 127 | 19th/75 | 2.4 | 45th/75 |
| 2010 | Angels | 558 | 126 | 17th/73 | 1.5 | 50th/73 |
| 2011 | Athletics | 585 | 93 | 57th/76 | 0.2 | 65th/76 |
| 2012 | Rays | 103 | 20 | - | -1.0 | - |
In 2004 he ranked 8th in the AL in wRC+ but only 43rd in WAR.
The same pattern runs from 2005 to 2010: 16th to 19th in wRC+, 35th to 50th in WAR.
Stacking the WAR components by season shows why he drops in WAR.
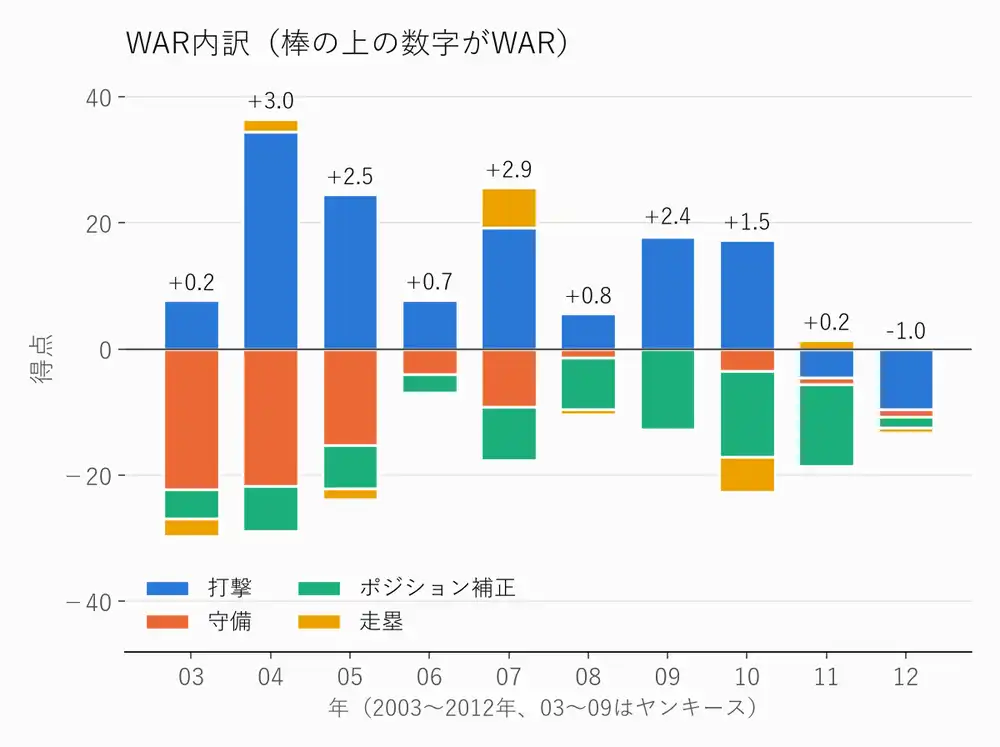
I summed the components over ten years.
| Component | Ten-year total (runs) |
|---|---|
| Batting | +120.3 |
| Fielding | -79.4 |
| Positional | -79.1 |
| Baserunning | -1.4 |
| League adjustment | +19.4 |
| Replacement level | +154.2 |
Fielding and the positional adjustment together come to -158.5 runs, more than the +120.3 he earned with the bat.
His WAR still ends up positive at 13.2 because the replacement-level credit of +154.2 and the league adjustment of +19.4 are added on.
The replacement-level credit is added in proportion to plate appearances: +21.5 in 2003, when he had 695 plate appearances, and +3.0 in 2012, when he had 103.
Over his 5,066 plate appearances in ten years, it totaled +154.2.
While he played the outfield in 2003–2005, he lost 15 to 22 runs a year on defense alone.
His -22.2 fielding runs in 2003 ranked last among the 166 qualified hitters in all of MLB.
From 2009 he was mostly a DH, and the fielding deficit nearly disappeared.
In its place the positional deduction grew to about -13 runs a year, and that deduction ate up most of what he earned with the bat.
Swing data from 2008 on
From 2008 on, pitch-by-pitch data lets you look inside his swings.
Pitch location and velocity through 2014 were measured by PITCHf/x, a system that tracked pitches with cameras installed in ballparks.
Statcast, used from 2015, measures pitches differently.
I counted Baseball Savant’s zone values 1–9 (its nine-way split of the strike zone) as in-zone and everything else as out-of-zone, and compared him with the average of all left-handed hitters that season.
The league-wide data is about 700,000 pitches per season, with bunts excluded.
In the table, chase rate is the share of pitches outside the strike zone that he swung at, and contact rate is the share of swings that made contact.
Swinging-strike rate (all pitches) is the share of all pitches that he swung and missed at, and the rightmost column is the share of swings that missed against fastballs of 93 mph (about 150 km/h) or more.
| Year | Hitter | Chase rate | Contact rate | Swinging-strike rate (all pitches) | Whiffs per swing vs. 93+ mph fastballs |
|---|---|---|---|---|---|
| 2008 | Matsui | 25.1% | 86.6% | 5.8% | 8.6% |
| 2008 | LHB average | 28.0% | 81.7% | 8.1% | 14.8% |
| 2009 | Matsui | 23.8% | 84.1% | 6.3% | 8.4% |
| 2009 | LHB average | 27.1% | 81.4% | 8.1% | 15.1% |
| 2010 | Matsui | 20.2% | 84.5% | 6.1% | 15.4% |
| 2010 | LHB average | 27.5% | 81.1% | 8.2% | 15.0% |
| 2011 | Matsui | 24.3% | 85.4% | 5.9% | 9.1% |
| 2011 | LHB average | 28.4% | 81.2% | 8.4% | 15.3% |
In all four years, his chase rate was 3 to 7 points below the left-handed average and his contact rate 3 to 5 points above it.
Even at 34 to 37, he was a hitter who laid off balls and made contact when he swung.
Against fastballs of 93 mph or more, he missed on 8–9% of his swings, about 60% of the left-handed average of roughly 15%.
The exception is 2010, when he rose to 15.4%, right at the average.
He faced about 300 to 450 fastballs of 93 mph or more per season and swung at fewer than half of them.
The year-to-year differences may be within the noise.
Batted-ball direction
From the same data, I used Baseball Savant’s hit coordinates to compute each batted ball’s angle from home plate.
For a left-handed hitter, balls more than 15 degrees toward first base count as pulled.
Batted-ball types (ground ball, line drive, fly ball) in this era were classified by stringers watching the game.
| Year | Hitter | Ground balls pulled | Fly balls pulled | Ground-ball share of batted balls |
|---|---|---|---|---|
| 2008 | Matsui | 65.1% | 25.0% | 47.6% |
| 2008 | LHB average | 56.7% | 25.0% | 45.6% |
| 2009 | Matsui | 67.9% | 31.9% | 38.9% |
| 2009 | LHB average | 57.0% | 25.8% | 45.5% |
| 2010 | Matsui | 67.1% | 31.4% | 41.0% |
| 2010 | LHB average | 58.6% | 25.2% | 45.9% |
| 2011 | Matsui | 56.7% | 31.8% | 42.8% |
| 2011 | LHB average | 59.3% | 26.5% | 46.1% |
From 2008 to 2010, two-thirds of his ground balls went to the first-base side, 8 to 11 points more than the left-handed average.
In 2009, when he hit 28 home runs, ground balls fell to 38.9% of his batted balls, 6.6 points below the left-handed average.
His ISO that year was .235, the highest of his ten MLB seasons, so the year his ground balls dropped and his pulled fly balls rose was also his best year for extra-base power.
In 2011, when his wRC+ fell to 93, he pulled 56.7% of his ground balls, below the left-handed average for the first time.
Against left-handers, with runners in scoring position, and in the postseason
I summed ten years of his MLB situational splits from the MLB Stats API (statSplits).
| Situation | PA | AVG | OBP | SLG | OPS | HR |
|---|---|---|---|---|---|---|
| Overall | 5066 | .282 | .360 | .462 | .822 | 175 |
| vs. RHP | 3534 | .281 | .367 | .464 | .831 | 119 |
| vs. LHP | 1532 | .284 | .345 | .457 | .802 | 56 |
| Runners in scoring position | 1493 | .294 | .379 | .472 | .851 | 46 |
| Postseason career | 235 | .312 | .391 | .541 | .933 | 10 |
| 2009 World Series | 14 | .615 | .643 | 1.385 | 2.027 | 3 |
His OPS against left-handers was only .029 lower than against right-handers, and his batting average was actually higher against lefties.
In the postseason he had a .933 OPS over 235 plate appearances.
That is more than 10% higher than his .822 career regular-season mark.
In the 2009 World Series, where he became the first Japanese-born player to win the MVP award, he went 8-for-13 with 3 home runs and 8 RBI in six games.
Compared with other Japanese position players in MLB
Using the same MLB Stats API values, I lined up career totals for Japanese position players in MLB.
For each player I fetched people/{player ID}/stats?stats=sabermetrics season by season and summed the seasons he played.
I limited the list to players with 1,000 or more plate appearances and converted batting runs to a per-600-plate-appearance rate.
2026 numbers are as of October 24, 2026, when I fetched them.
Shohei Ohtani’s WAR here covers his hitting only and does not include his pitching.
| Player | Years | PA | Batting (runs) | Batting per 600 PA | Fielding (runs) | WAR |
|---|---|---|---|---|---|---|
| Shohei Ohtani | 2018–2026 | 4947 | +317.2 | +38.5 | 0.0 | 39.6 |
| Seiya Suzuki | 2022–2026 | 2899 | +98.8 | +20.4 | +6.9 | 15.7 |
| Hideki Matsui | 2003–2012 | 5066 | +120.3 | +14.2 | -79.4 | 13.2 |
| Masataka Yoshida | 2023–2026 | 1503 | +16.9 | +6.7 | -11.0 | 2.0 |
| Norichika Aoki | 2012–2017 | 3044 | +17.4 | +3.4 | +13.3 | 10.8 |
| Ichiro Suzuki | 2001–2019 | 10734 | +54.0 | +3.0 | +158.9 | 59.8 |
| Kosuke Fukudome | 2008–2012 | 2276 | +2.8 | +0.7 | -20.6 | 3.8 |
| Kenji Johjima | 2006–2009 | 1722 | -18.9 | -6.6 | +11.0 | 3.4 |
| Akinori Iwamura | 2007–2010 | 1755 | -20.8 | -7.1 | -22.7 | 3.2 |
| So Taguchi | 2002–2009 | 1524 | -21.1 | -8.3 | -0.2 | 3.0 |
| Tadahito Iguchi | 2005–2008 | 2079 | -32.1 | -9.3 | -6.5 | 8.2 |
| Kaz Matsui | 2004–2010 | 2555 | -66.9 | -15.7 | -6.5 | 5.7 |
In career batting runs, Matsui’s +120.3 ranks second, behind only Ohtani.
Per 600 plate appearances, Ohtani and Seiya Suzuki are ahead of him.
Next to Ichiro, the source of their value is reversed: one earned it with the bat, the other with the glove.
Ichiro’s batting was close to average at +3.0 per 600 plate appearances, and his +158.9 fielding runs make up a large part of his 59.8 WAR.
He also had 10,734 plate appearances, more than twice Matsui’s total, so his replacement-level credit is larger as well.
Matsui earned +120 runs with the bat, and most of that was taken back by fielding and the positional adjustment.