Building a Log Viewer for Codex and Claude Code Subagent Time and Tokens
 Contents
In a previous post, I restructured Codex’s orchestration setup to keep usage under control.
Even with that in place, single operations still occasionally dragged on for hours.
Looking at running processes on my machine gave me a rough idea of what was active.
What it couldn’t tell me was what individual subagents were actually doing inside the orchestration.
In a few repositories, I had instructed subagents to log their start and finish states to Markdown files, but relying on agent compliance meant entries were skipped or incomplete—making it impossible to maintain across every repo.
I abandoned having agents log their own status and instead built a viewer that parses the session logs Codex and Claude Code already write to disk, reconstructing subagent states and runtimes from the raw event history.
Tracing those logs also exposed exact token usage, so I aggregated data across 30 days of sessions.
Environment
| Item | Details |
|---|---|
| Machine | Mac mini (M4) |
| Codex CLI | 0.154.0 |
| Claude Code | 2.1.274 |
| Viewer | SwiftUI interface with a Python parser script (standard library only) |
| Period | 30 days from August 19 to September 18, 2026 (257 sessions total, 129 with subagents) |
Subagents Are Just Threads
At first, I used ps and lsof to scan for processes, generating a list by comparing workspace directories and log modification timestamps.
That showed where a task was running.
However, even when Codex was actively orchestrating multiple subagents, only a single codex process ever appeared.
Checking the open file descriptors of that process via lsof revealed that it had six session log files (rollout-*.jsonl) open simultaneously under ~/.codex/sessions/.
Subagents are not child processes; they are threads inside the same process, and each thread writes its own rollout log.
The first line of each rollout (session_meta) specifies the parent-child relationship.
| Field | Example | Description |
|---|---|---|
parent_thread_id | Parent’s thread ID | Links child to parent |
agent_path | /root/review_worker | Role name assigned by parent |
agent_nickname | Pasteur | Codex’s internal agent nickname |
source.subagent.thread_spawn.depth | 1 | Depth relative to parent |
The same rollout records what the subagent executed: invoked commands, files edited with apply_patch, subagent waits with wait_agent, and completion reports with runtimes via task_complete are all stored in plaintext.
Only the prompt text passed by the parent (message inside spawn_agent or send_message) was not preserved in plaintext.
For Claude Code, subagents spawned via the Agent tool write to <session-id>/subagents/agent-*.jsonl in the conversation directory.
An accompanying .meta.json file contains the initial prompt description, agent type, model, and the parent’s toolUseId.
Categorizing Time from Logs
Every event in both log formats carries a timestamp.
By tracking state transitions chronologically, the viewer aggregates the duration spent in each state.
Runtimes for sessions when the viewer wasn’t open can be reconstructed later in the same way.
| State | Triggering Event | Description |
|---|---|---|
| Thinking | Turn start, tool execution returned | Time until model outputs next action (includes API latency) |
| Tool | Tool call dispatched | Time waiting for tool output |
| Waiting on child | wait_agent, sleep, or foreground subagent call in Claude Code | Time parent waited while child was actively working |
| Other wait | Same as above | Time parent waited when no child was actively working |
| Waiting for input | task_complete, turn_aborted, end_turn, interrupted | Time waiting for human input |
flowchart TD
  A[Input received] --> B[Thinking]
  B --> C[Tool]
  C --> B
  B --> D[Waiting on child]
  D --> B
  B --> E[Waiting for input]
  E --> A
Time during which the parent finished its turn and sat idle while subagents continued working is also counted under “Waiting on child.”
This accounts for fire-and-forget background subagents in Claude Code where the parent doesn’t hold an active wait call.
The sum of all categories matched total process uptime across all 257 sessions without discrepancy.
A single rollout log can reach 17MB, and reparsing entire files every three seconds caused severe lag.
The viewer maintains processed byte offsets and accumulated state, seeking directly to the end and parsing only appended increments.
Counting Adjustments
Applying initial logic to real session data exposed several edge cases that required adjustments.
| Initial Logic | Initial Result | What Actually Happened | Fix |
|---|---|---|---|
Child wait only during wait_agent | Parent active 99% in a 21-child session | Parent waited with 49 sleep and 76 list_agents calls | Count sleep as child wait. Corrected to 82% active, 13% child wait |
Claude subagents complete on end_turn | 50% completion rate, 1h 34m thinking per turn | 167 of 300 recent subagents ended with plain text responses without writing end_turn | Treat trailing text response as completion. Rate rose to 100% |
| Only inspect open rollouts | Parent had 1h 19m of “Other wait” | Codex closes completed subagent rollouts | Include closed subagent rollouts from the same session. Other wait dropped to ~0 |
| Count Claude tokens once per response | Output numbers were too low | Responses were split across multiple lines, and in 604 of 1,386 instances, values increased across lines | Take the final line’s value per response |
I also investigated why Codex subagents reported such tiny tool durations.
Codex runs long commands in the background and periodically polls output via write_stdin.
Aggregating two gpt-6-astra subagents showed that the duration before polling calls was under 1% of total time.
Thinking time was overwhelmingly model inference latency.
Breakdown of a Single Session
I examined a session where Codex (parent running gpt-5.6-sol medium) processed a batch of outstanding backlog tasks in a production repository.
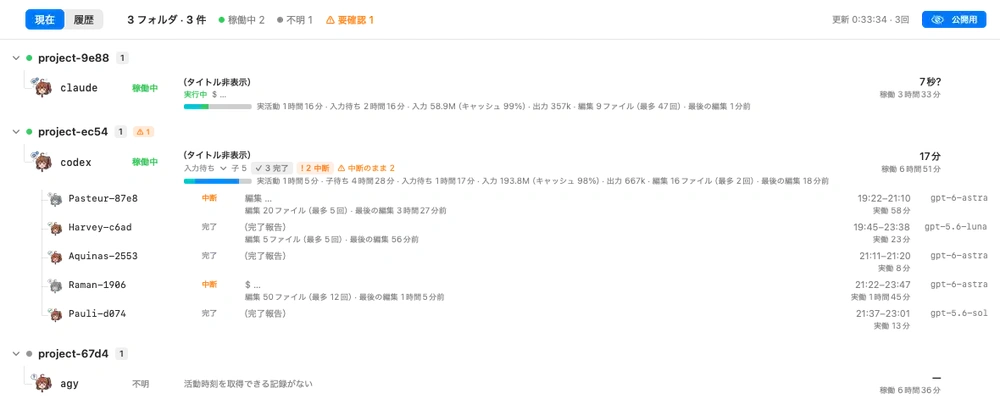
The Live tab groups agents by workspace directory, placing subagents directly under their parent Codex process.
The parent row displays subagent counts by status (completed, interrupted) along with warning flags.
A horizontal stacked bar underneath shows the runtime breakdown (thinking, tool, child wait, input wait), flanked by token counters on the right.
The screenshot above uses a redacted view that masks folder names, task titles, subagent identifiers, commands, and completion summaries.
Aggregating this session at capture time produced the following breakdown:
| Metric | Value |
|---|---|
| Total time | 6h 33m |
| Active (thinking + tool) | 1h 5m (17%) |
| Waiting on child | 4h 28m (68%) |
| Waiting for input | 59m (15%) |
| Subagents | 10 total (8 completed, 2 interrupted), max 2 concurrent |
| Input tokens | 193.8M (98% cache hit) |
| Output tokens | 668k (parent 129k, children 538k) |
The parent spent 4 hours and 28 minutes—roughly 70% of the entire 6-hour-33-minute session—waiting for subagents to finish.
Input tokens totaled 193.8M (~194 million tokens), of which 98% hit the prompt cache. Output tokens totaled 668k (~668 thousand tokens), with subagents accounting for 80% of that volume.
Breaking down subagent activity by model produced the following table:
| Subagent Model | Count | Calls | Thinking / Call | Thinking Total | Tool Total | Output Tokens |
|---|---|---|---|---|---|---|
| gpt-5.6-luna max | 4 | 206 | 12s | 40m | 1m | 104k |
| gpt-5.6-sol high | 3 | 485 | 10s | 80m | 11m | 187k |
| gpt-6-astra high | 3 | 515 | 19s | 161m | 12m | 247k |
The three gpt-6-astra high subagents had roughly the same number of invocations as sol high, but their per-call thinking latency was nearly double.
Out of 281 total minutes of child thinking time, astra accounted for 161 minutes.
30-Day Historical Data
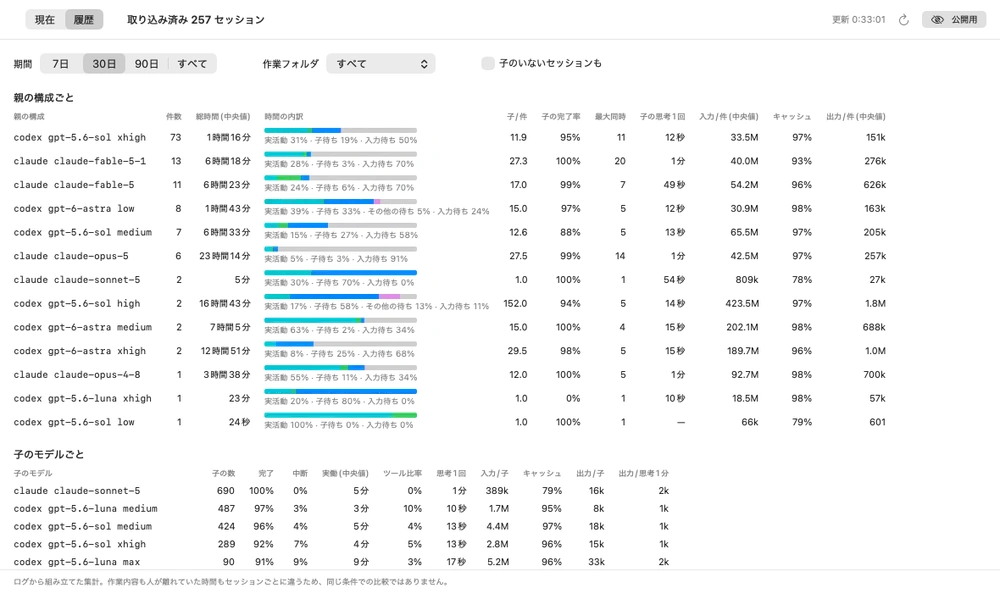
The History tab aggregates past sessions from stored logs, categorizing them by parent configuration and child model.
Because metrics are cached independently, the data persists even if raw session logs are pruned.
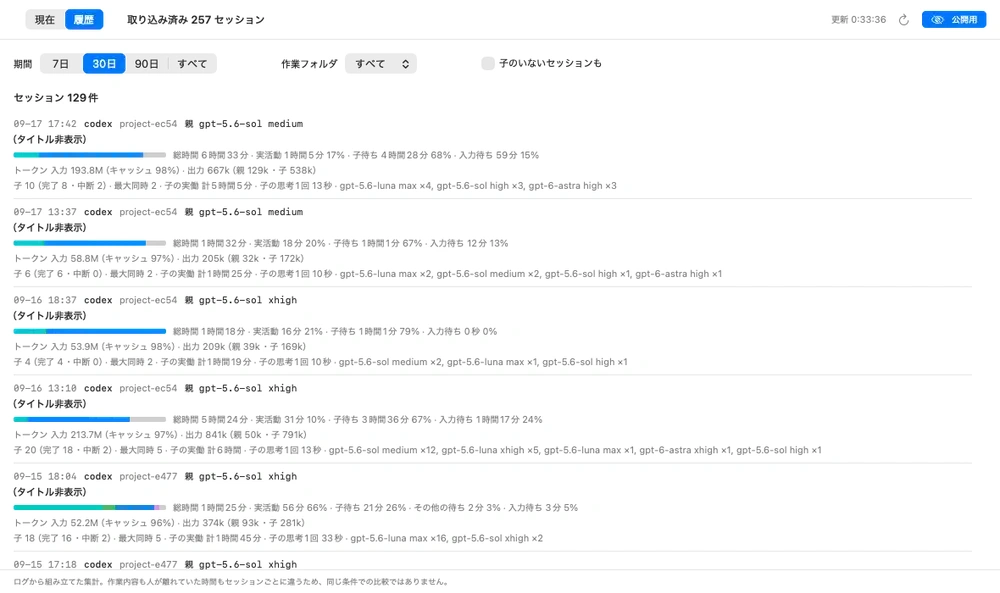
The session list shows runtime breakdowns, token consumption, subagent completion rates, and model distributions per session.
By Parent Configuration
Sessions with subagents over the last 30 days that had at least two runs with identical parent configurations.
Percentages represent the ratio of total summed hours across sessions, rather than averages of per-session percentages.
| Parent Configuration | Count | Total Time (Median) | Active | Child Wait | Input Wait | Children / Session | Child Completion | Input / Session (Median) | Cache Rate | Output / Session (Median) |
|---|---|---|---|---|---|---|---|---|---|---|
| codex gpt-5.6-sol xhigh | 73 | 1h 16m | 31% | 19% | 50% | 11.9 | 95% | 33.5M | 97% | 151k |
| claude claude-fable-5-1 | 13 | 6h 18m | 28% | 3% | 70% | 27.3 | 100% | 40.0M | 93% | 277k |
| claude claude-fable-5 | 11 | 6h 23m | 24% | 6% | 70% | 17.0 | 99% | 54.2M | 96% | 627k |
| codex gpt-6-astra low | 8 | 1h 43m | 39% | 33% | 24% | 15.0 | 97% | 30.9M | 98% | 164k |
| codex gpt-5.6-sol medium | 7 | 6h 33m | 15% | 27% | 58% | 12.6 | 88% | 65.5M | 97% | 205k |
| claude claude-opus-5 | 6 | 23h 14m | 5% | 3% | 91% | 27.5 | 99% | 42.5M | 97% | 258k |
| claude claude-sonnet-5 | 2 | 5m | 30% | 70% | 0% | 1.0 | 100% | 809k | 78% | 27k |
| codex gpt-6-astra medium | 2 | 7h 5m | 63% | 2% | 34% | 15.0 | 100% | 202.1M | 98% | 689k |
| codex gpt-5.6-sol high | 2 | 16h 43m | 17% | 58% | 11% | 152.0 | 94% | 423.5M | 97% | 1.8M |
| codex gpt-6-astra xhigh | 2 | 12h 51m | 8% | 25% | 68% | 29.5 | 98% | 189.7M | 96% | 1.0M |
Input wait includes idle time where a human stepped away after issuing a command.
Excluding input wait, Codex parents (96 sessions) split their time almost evenly: 53% active work and 45% waiting on subagents.
In contrast, Claude Code parents (33 sessions) spent 85% in active work and only 15% waiting on subagents, doing most of the heavy lifting directly.
For sessions with three or more subagents, the maximum number of concurrently running subagents was a median of 4 in Codex (25 of 69 sessions had 2 or fewer) and a median of 7 in Claude Code.
By Child Model
Models with at least five subagent instances recorded.
Columns represent:
| Column | Definition |
|---|---|
| Active | Thinking + Tool time (median per subagent) |
| Tool Ratio | Percentage of active time spent waiting for tool output |
| Thinking / Call | Total thinking duration divided by number of calls |
| Input / Child | Input tokens per subagent (includes cache hits) |
| Non-Cached Input / Child | Input tokens excluding cache hits |
| Output / Thinking Min | Output tokens generated per minute of thinking (includes reasoning tokens) |
| Child Model | Count | Completion | Active (Median) | Tool Ratio | Thinking / Call | Input / Child | Cache Rate | Non-Cached Input / Child | Output / Child | Output / Thinking Min |
|---|---|---|---|---|---|---|---|---|---|---|
| claude claude-sonnet-5 | 690 | 100% | 5m | 0% | 1m | 389k | 79% | 81k | 17k | 3k |
| codex gpt-5.6-luna medium | 487 | 97% | 3m | 10% | 10s | 1.7M | 95% | 76k | 9k | 2k |
| codex gpt-5.6-sol medium | 424 | 96% | 5m | 4% | 13s | 4.4M | 97% | 119k | 18k | 2k |
| codex gpt-5.6-sol xhigh | 289 | 92% | 4m | 5% | 13s | 2.8M | 96% | 113k | 15k | 2k |
| codex gpt-5.6-luna max | 90 | 91% | 9m | 3% | 17s | 5.2M | 96% | 220k | 34k | 2k |
| codex gpt-5.6-terra medium | 72 | 99% | 5m | 6% | 13s | 2.1M | 96% | 77k | 12k | 1k |
| codex gpt-5.6-sol high | 34 | 88% | 12m | 5% | 14s | 9.0M | 97% | 232k | 36k | 2k |
| codex gpt-5.6-luna xhigh | 30 | 87% | 13m | 4% | 13s | 10.9M | 97% | 304k | 55k | 3k |
| codex gpt-6-astra xhigh | 13 | 100% | 11m | 1% | 34s | 2.3M | 95% | 111k | 22k | 1k |
| claude claude-opus-5 | 12 | 92% | 2m | 1% | 36s | 365k | 79% | 76k | 2k | 678 |
| codex gpt-6-astra high | 9 | 78% | 8m | 6% | 19s | 8.0M | 98% | 186k | 32k | 1k |
| codex gpt-6-astra medium | 8 | 100% | 2m | 1% | 32s | 2.2M | 95% | 119k | 18k | 2k |
| claude claude-fable-5 | 7 | 100% | 10m | 21% | 7s | 902k | 69% | 280k | 40k | 5k |
| codex gpt-5.6-luna low | 6 | 100% | 56s | 2% | 7s | 211k | 92% | 17k | 2k | 2k |
| claude claude-haiku-4-5-20251001 | 5 | 100% | 1m | 32% | 3s | 515k | 89% | 55k | 5k | 6k |
| codex gpt-5.6-terra high | 5 | 80% | 3m | 3% | 17s | 824k | 93% | 60k | 11k | 1k |
Actual tool execution took up only 5% of active subagent time in Codex and 1% in Claude Code.
Over 95% of active duration was spent waiting for model responses; time spent on command execution and file operations was negligible.
Per-call thinking latency ranged between 7 and 17 seconds for gpt-5.6 models (sol, luna, terra), and between 19 and 34 seconds for gpt-6-astra.
Token Consumption
Because agents re-send previous conversation context with every invocation, input tokens scale up quickly, with the vast majority handled by prompt caching.
| Metric | Codex (96 sessions) | Claude Code (33 sessions) |
|---|---|---|
| Total input tokens | 8,507.1M | 1,905.8M |
| Cache hit rate | 97% | 95% |
| Total output tokens | 35.3M | 17.6M |
| Subagent share of output | 68% | 67% |
Across 30 days, total input reached 8,507.1M (~8.5 billion tokens) for Codex and 1,905.8M (~1.9 billion tokens) for Claude Code, with over 95% hitting the prompt cache in both environments.
Output totaled 35.3M tokens for Codex and 17.6M tokens for Claude Code, with subagents generating roughly two-thirds (67–68%) of all output volume.
Subagent input ranged from 0.2M to 10.9M tokens per instance, while non-cached input sat between 17k and 304k.
Output per subagent ran between 2k and 55k tokens. Output generated per minute of thinking was remarkably consistent across Codex models at 1k to 3k tokens.
gpt-6-astra generated 1k to 2k tokens per minute, sitting at the bottom of that band.
Token counting semantics differ between runtimes:
| Runtime | Accounting Method |
|---|---|
| Codex | Final total_token_usage inside token_count per thread. Remains cumulative across context compressions (compact) and matches the sum of turn-by-turn usage. Parent counters exclude child usage |
| Claude Code | Per-response usage. Total inputs include both cache creation and cache read hits |
Limitations of the Numbers
Key constraints to keep in mind when interpreting these numbers:
| Limitation | Details |
|---|---|
| Workload variance | This is not an A/B benchmark running identical tasks. Task scope and human idle times varied across sessions, and parent sessions running gpt-6-astra only had 2 to 8 runs per configuration |
| Thinking breakdown | Includes network round-trips and API queueing; cannot isolate pure model inference time |
| Codex tool ratio | Measures time subagents blocked on tool returns, omitting runtimes of long background commands detached from the CLI |
| Log stability | Reverse-engineered from local Codex CLI 0.154.0 and Claude Code 2.1.274 output. Older logs like Codex 0.78.0 from January 2026 did not log turn boundaries and could not be parsed |
| Token reconciliation | Verified internal consistency across log events, but not reconciled against billed invoices |